Upper Hutt sits squarely atop the deep alluvial gravels and silts of the Hutt Valley, where the 1855 Wairarapa earthquake—magnitude 8.2 on the Alpine Fault's northern extension—lifted the entire Rimutaka Range by over 2.5 metres. This is not ancient geology; it is active tectonics that shapes every foundation poured in Trentham, Silverstream, and Totara Park. Seismic microzonation here demands more than a regional hazard map because the Hutt River’s paleochannels, buried peat lenses, and variable depth to bedrock produce abrupt lateral changes in ground motion amplification. Our approach combines downhole shear-wave velocity profiling with MASW surface wave arrays to map VS30 across the site, then feeds those velocities into site-specific response analyses that capture impedance contrasts at the gravel-bedrock interface. The result is a set of design acceleration spectra tailored to your parcel, not a generic spectrum pulled from NZS 1170.5 for a broad soil class that may misrepresent what lies beneath the top 30 metres.
A seismic microzonation study in Upper Hutt maps the three-dimensional impedance architecture so that foundation design responds to site-specific amplification, not a regional soil class.
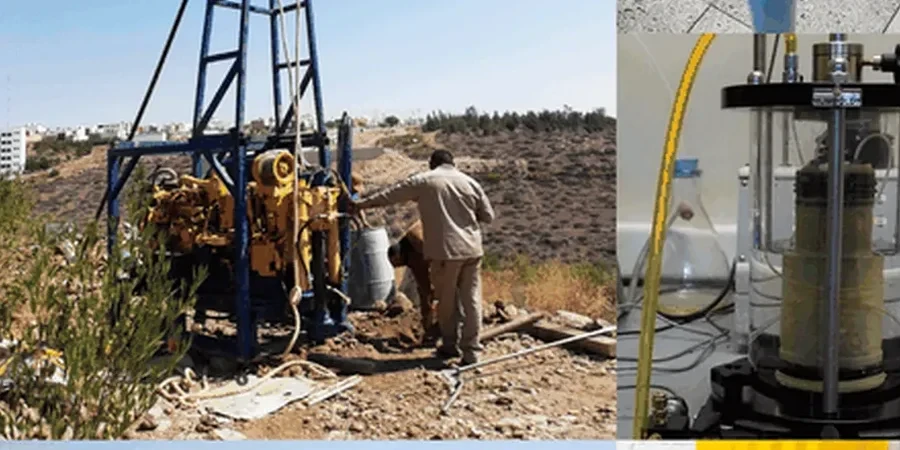
Methodology applied in Upper Hutt
What emerges is a colour-banded site plan that delineates zones of uniform response: areas where spectral acceleration at 0.3 seconds is governed by a shallow gravel layer, zones where deep soft sediments push the fundamental period past 1.2 seconds, and narrow transition bands where basin-edge effects from the buried greywacke basement amplify vertical motion. This map becomes the geotechnical brief for every subsequent design decision—foundation type, ground improvement, structural period tuning.
Critical ground factors in Upper Hutt
NZS 1170.5:2004 provides the national framework, but its default site subsoil classes are blunt instruments in Upper Hutt. A deep soil site class D might be assigned based on a single borehole that happens to intersect a thick gravel package, while the southern half of the property sits over 25 metres of compressible silts that would correctly classify as site class E—yet the design spectra for D and E differ by up to 40% in the 0.1 to 0.5-second period range critical for low-rise structures. The NZGS Module on Seismic Assessment of Existing Buildings and the MBIE/NZGS guidance on liquefaction assessment both direct practitioners toward site-specific studies when subsurface variability is high, which describes nearly every site in the Hutt Valley.
Liquefaction-induced lateral spreading along the Hutt River’s historical meander belts represents a secondary hazard that microzonation explicitly addresses. We map the factor of safety against liquefaction triggering and estimate post-liquefaction settlement and lateral displacement using the empirical curves of Zhang et al. (2002) and the NZGS-MBIE framework. For projects within 200 metres of the river corridor, these estimates often govern foundation depth and ground improvement scope, because a half-metre of differential settlement across a slab-on-grade translates to structural damage far exceeding the cost of pre-construction mitigation.
Our services
A seismic microzonation study for an Upper Hutt site draws together several investigative techniques that we coordinate under a single testing programme. Each method addresses a specific piece of the subsurface puzzle, from dynamic soil properties to liquefaction susceptibility.
Multi-Method Geophysical Survey
Active and passive MASW arrays, seismic refraction lines, and downhole PS logging to build a layered VS profile and map the depth to engineering bedrock (VS ≥ 760 m/s) across the full site. Horizontal-to-vertical spectral ratio (HVSR) measurements identify fundamental site periods in areas of deep alluvium.
CPT-Based Liquefaction and Cyclic Softening Assessment
Seismic cone penetration testing with pore pressure measurement (CPTu) at a grid spacing calibrated to the site's stratigraphic complexity. We process CPT data through the Boulanger & Idriss (2014) triggering procedure and estimate post-liquefaction volumetric strain and lateral displacement for input to foundation performance evaluation.
One- and Two-Dimensional Site Response Analysis
Equivalent-linear analysis in DEEPSOIL for moderate strain levels, with nonlinear time-domain modelling in PLAXIS or FLAC where soft organic silts produce strains exceeding the equivalent-linear validity range. We output surface acceleration, velocity, and displacement spectra, Arias intensity profiles, and ground motion time histories compatible with NZS 1170.5 design spectra.
Frequently asked questions
How many investigation points are needed for a seismic microzonation study on a typical Upper Hutt residential subdivision?
The number of investigation points depends on site area and subsurface variability, not a fixed ratio. For a 0.5 to 2-hectare subdivision we typically specify one CPT sounding per 500–800 m² and a MASW line spacing of 25 to 35 metres, plus at least one borehole to confirm stratigraphy and collect undisturbed samples for laboratory dynamic testing. Sites with mapped paleochannels or abrupt changes in gravel thickness may require tighter grids. The NZGS Module 3 guidance emphasises that the investigation density must be sufficient to capture the spatial scale of impedance contrasts that control amplification, which in the Hutt Valley can be tens of metres.
What is the typical cost range for a seismic microzonation study in Upper Hutt?
The cost for a seismic microzonation study in Upper Hutt ranges from NZ$7,010 to NZ$31,360, depending on site area, number of CPT and borehole locations, geophysical line-kilometres, and the complexity of the response analysis. A small residential lot requiring a single MASW line, one CPT, and equivalent-linear analysis sits at the lower end. A multi-hectare commercial development requiring a dense CPT grid, several boreholes, cross-hole testing, and nonlinear time-domain modelling sits at the upper end. We provide a fixed-price proposal after reviewing site geology, project scope, and any existing subsurface data.
How do you account for basin-edge effects in the Hutt Valley when performing site response analysis?
Basin-edge effects arise when seismic waves propagating through the greywacke basement encounter the steeply dipping valley margin and convert partially to surface waves that amplify ground motion near the edge. We address this by mapping basement depth with seismic refraction or MASW along transects perpendicular to the valley axis, then running two-dimensional site response models that capture lateral wave propagation and surface wave generation—something one-dimensional column models cannot do. For sites within approximately 300 metres of the mapped valley margin, the 2D analysis often predicts short-period amplification 20 to 40% higher than a 1D analysis, and we recommend the 2D spectra for structural design.
What ground motion records do you use as input for site response analysis, and are they compatible with NZS 1170.5?
We select and scale real earthquake records from the PEER NGA-West2 database, prioritising events recorded on rock sites with magnitude-distance combinations consistent with the New Zealand seismotectonic setting—typically crustal events in the Mw 6.5–8.0 range recorded at distances of 10–80 km. Each record suite is spectrally matched to the NZS 1170.5 uniform hazard spectrum for the site's location and return period (commonly 500 or 2500 years) using wavelet-based algorithms that preserve non-stationary frequency content. The matched suite typically contains seven records for code-based averaging, meeting the NZGS recommendation for a minimum of three and international best practice of seven. More info.